Use visual operating views
Review supported charts and summary measures for call activity, teams, and costs.
Move between high-level trends and focused team views without turning every operational question into a separate spreadsheet.
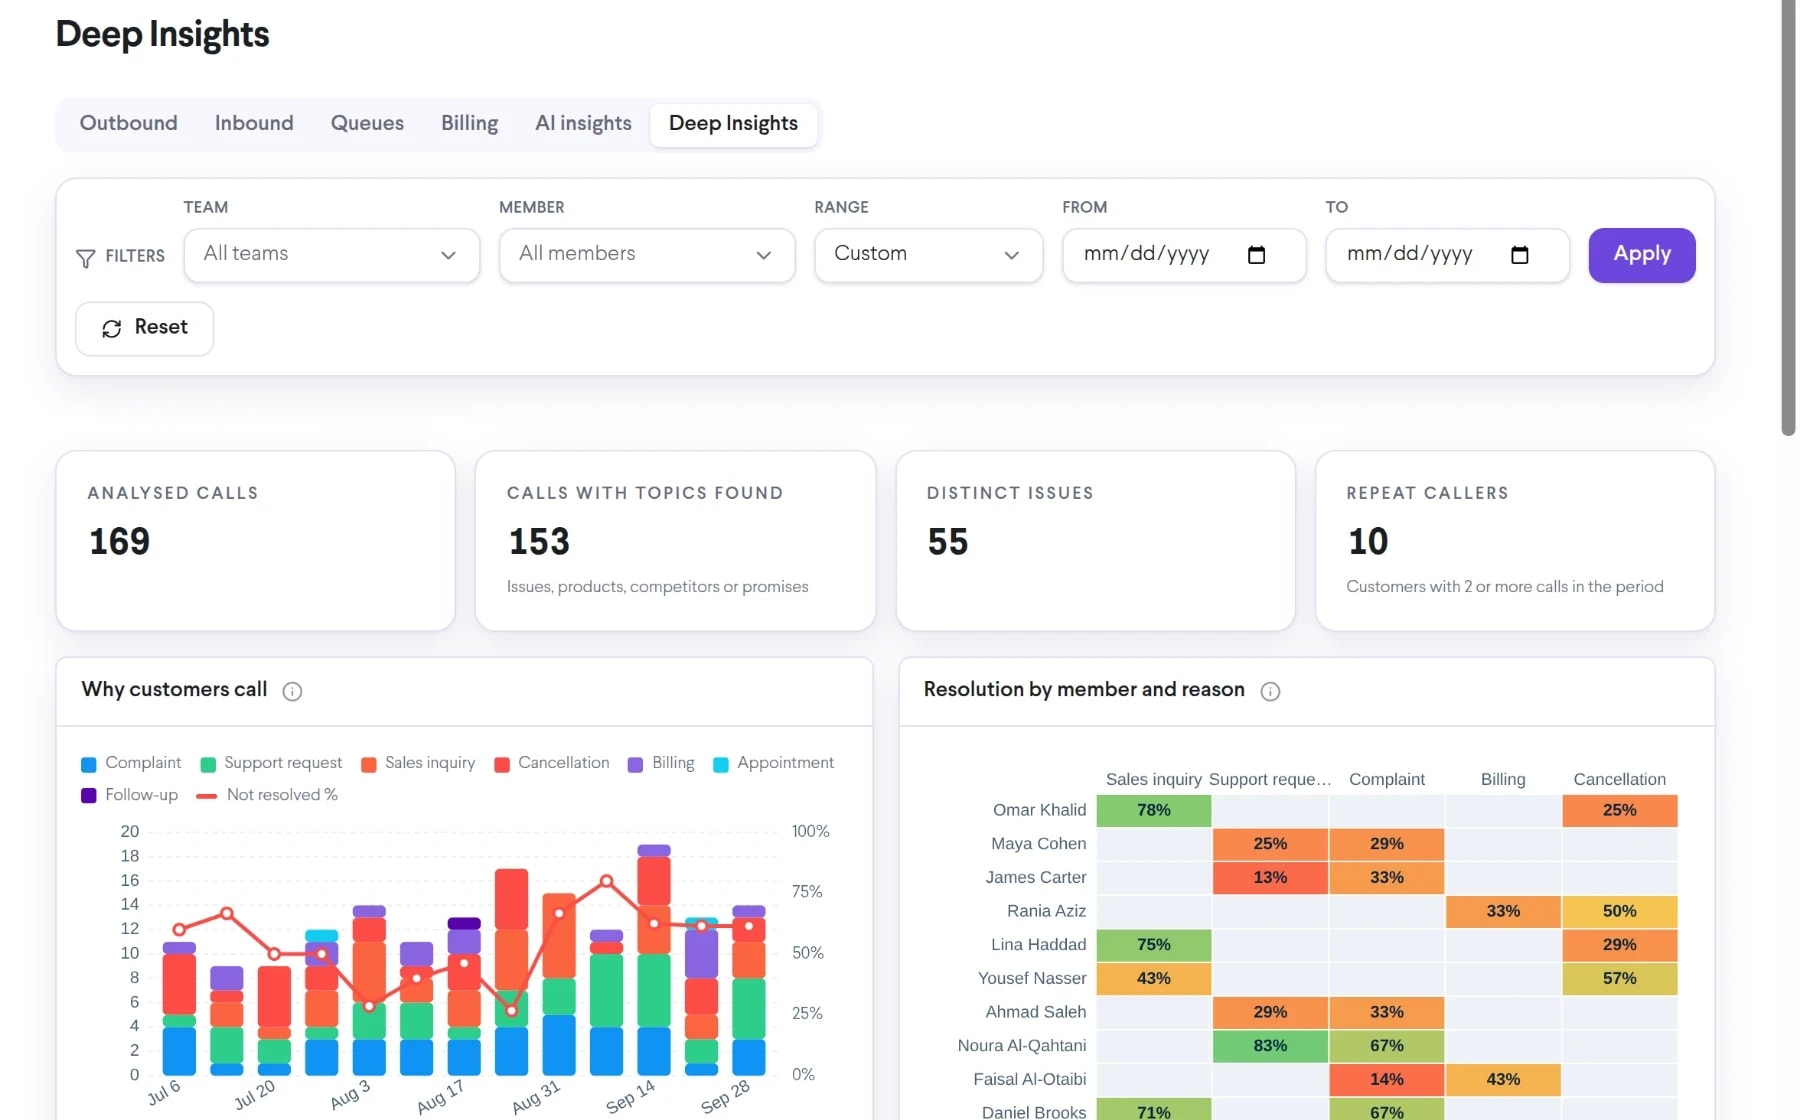
Bring interactive bi dashboards into the same connected experience as your business calls, customer conversations, and team collaboration.
Review supported charts and summary measures for call activity, teams, and costs.
Change the period and available organizational dimensions to investigate a specific pattern.
Use a common dashboard view during operational and management discussions.
See how interactive bi dashboards moves from setup to everyday use inside TalkChief.
Choose the inbound, outbound, billing, or other available view aligned to the question.
Narrow the view by time, team, member, or supported data dimension.
Use the visible trend as a starting point for a report, coaching review, or workflow change.
Explore related capabilities that bring calling, customer service, and teamwork together.
Analyze call volume, answer patterns, talk time, agent activity, and queue performance in TalkChief call center dashboards.
Explore Call Center Analytics →AnalyticsFollow active and recent TalkChief call activity in a live operational feed designed for supervisors and contact-center teams.
Explore Live Call Feed →AnalyticsReview and share structured TalkChief call reports covering activity, outcomes, duration, teams, members, and available financial data.
Explore Comprehensive Call Reports →Contact centerConnect reporting with routing, supervision, call records, and team performance.
Explore →All featuresDiscover business phone, contact-center, productivity, analytics, and Cowork features.
Explore →